
New Zealand vs Australia | Aussie Super vs KiwiSaver
This post was originally written and shared here on 11th July, 2024 by Xavier Waterstone of QuayStreet. Waterstone unpacks how:
New Zealand’s KiwiSaver tax and contributions regime results in poorer outcomes for retirement balances versus Australia’s superannuation system.
KiwiSaver, originally envisioned as a cornerstone of New Zealand’s generational prosperity, was created to encourage saving for retirement, implicitly acknowledging a future where the public pension (NZ Super) would no longer be able to adequately provide for an ageing population. Beneath this notion of what KiwiSaver was designed to achieve lies a deeper narrative on taxation and contributions, shaping outcomes which contrast starkly with Australia's more pragmatic system.
Despite being critical to the financial wellbeing of all New Zealanders, the structure of our retirement savings system, or ‘KiwiSaver’ as it is commonly known, receives limited scrutiny and lacks some commonsense measures to improve the outcomes it produces for members. What attention KiwiSaver does get tends to be about fees. While fees make for an easy bone of contention because of their visibility, their effect pales in comparison to the much larger impact of taxes and contributions.
This article unpacks how New Zealand’s contribution and tax regime for KiwiSaver results in poorer outcomes for savings balances in retirement, using Australia’s superannuation system as a comparison.
What quickly becomes evident is the disadvantage working Kiwis are at versus our counterparts across the ditch when it comes to saving for retirement; and the need for meaningful reform to make the KiwiSaver system better fit for purpose.
From a sovereign point of view, the current system generates more tax revenue up front, but at the cost of a greater funding burden for the safety net (NZ Super) in the future. The main reason for this is deadweight loss from a tax regime that takes away compounding power from individual contributions, which hampers long-term accumulation of KiwiSaver balances.
To give some initial context on how this deadweight loss is created, we first need sketches outlining how the mechanics of the two systems work. For Australia, the only relevant taxing point in our simplified example is the superannuation fund itself. This is because contributions to the fund are effectively taxed inside the fund as a ‘stream’ of fund income:
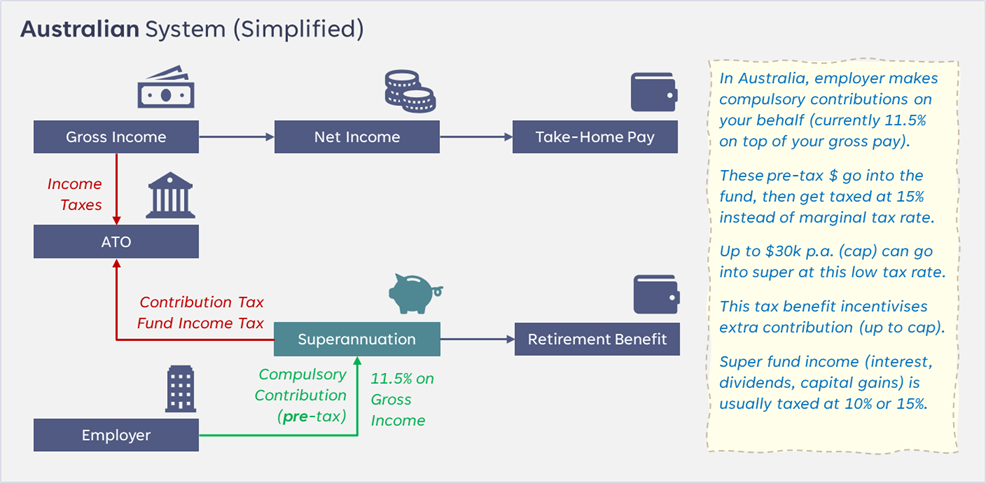
In New Zealand however, there are three relevant taxing points. There is the KiwiSaver fund itself for fund income, then additional taxing points for individual contributions, which are paid out of net income (i.e. income tax is taken out first), and employer contributions (where employer superannuation contribution tax or ‘ESCT' is taken out first). The upshot of this is that tax leakage on contributions happens outside the fund.

To supplement the sketches, the table below shows a side-by-side comparison of the key features underlying the two countries’ retirement savings vehicles:

Though it may not be immediately obvious, New Zealand’s non-concessional taxes on contributions, coupled with a weaker regime that doesn’t compel or incentivise contributions, results in poorer outcomes, with Kiwis’ nest eggs far smaller than our cousins across the ditch.
To illustrate this, what follows is an exploration of the major differences between the KiwiSaver and Australian Superannuation systems, using scenarios of how various aspects of tax and contribution impact the level of retirement savings accumulated over a working career.
To make the breakdown easier to follow, it has been written as a case study of ‘Sam’:
Sam has just finished studies and training at 22, and has taken a role earning $50,000 gross, which increases at 3% p.a.
Sam elects to contribute 3% to KiwiSaver, which is matched by the employer
Sam continues to work and contribute to KiwiSaver until retiring at 65
Sam’s KiwiSaver fund delivers a constant return of 6% p.a. (before tax)
KiwiSaver Investment returns are taxed at an effective rate (ETR) of 8.1%
Because the application of tax in KiwiSaver is quite complex (PIE tax regime), an effective rate, based on the total PIE tax paid as a portion of gross income across the KiwiSaver system in the 10 years to 2023 is used instead
Scenario A: Status Quo (prevailing NZ tax rates & KiwiSaver system)
Under New Zealand’s current tax and KiwiSaver regime, by the age of retirement, Sam accumulates a KiwiSaver balance of approximately $793,000. This is comprised of (rounded):
+$322,000 gross pretax contributions (total of employee, employer, and government)
-$83,000 tax on contributions (with effective tax rate applied to individual)
+$603,000 pretax investment returns
-$49,000 tax on investment returns

Assuming Adrian Orr’s successors manage to hit the 2% midpoint of their target inflation range in the long run, this circa $793,000 future nest egg would be worth roughly $339,000 in today’s dollars. At a point-in-time rate of $3,000 per month, that’s about 9 years of living expenses.
Scenario B: Status Quo, but contributions taxed like Australia
In the second scenario, we assume that instead of effectively taxing employee/employer contributions at the individual’s effective income tax and ECST (employer contribution tax) rates, we instead use Australia’s prevailing 15% tax rate on retirement contributions. This change results in Sam’s lifetime balance improving by about 7% or $58,000 to roughly $852,000, broken down as:
+$302,000 gross contributions (less pay-away required due to lower tax)
-$42,000 tax on contributions ($41,000 less tax)
+$643,000 pretax investment returns (an extra $39,000)
-$52,000 tax on investment returns ($3,000 more tax)

Not only does Sam get the benefit of larger net contributions due to a lower tax take going in, but there is a very important knock-on effect on compounding. The cumulative effect of contributions going in with more ‘firepower’ over forty-plus years is that Sam’s compounding of investment returns gets magnified by the larger regular deposits.
Even though some of this additional return is lost to tax, the impact is still meaningful. Viewed another way, New Zealand’s higher tax leakage* on contributions vs Australia’s (concessional rate, for most taxpayers) penalises Sam’s compounding power by around $40,000 (in addition to the higher contribution tax by itself).
Rounding off this scenario, Sam’s $852,000 future nest egg would be worth some $363,000 in today’s dollars, or 10 years of living expenses at $3,000 per month, again assuming 2% annual inflation.
Scenario C: Status Quo, both contributions & returns taxed like Australia
For the third scenario, we make an additional change, and apply Australia’s slightly higher 8.9% effective tax rate or ‘ETR’ on rate on investment returns, instead of the historical 8.1% experience in New Zealand. We are now simulating Sam’s retirement balance as if Australia’s tax treatment applied to both contributions and returns. The resulting nest egg of approximately $841,000, made up of:
+$302,000 gross contributions (same as Scenario B)
-$42,000 tax on contributions (same as Scenario B)
+$637,000 pretax investment returns ($6,000 less than Scenario B)
-$94,000 tax on investment returns ($5,000 more tax than Scenario B)

While applying Australia’s tax experience on returns appears to dilute fund income, the takeaway here is that because we are using effective tax rates for the whole system instead of the individual settings, it isn’t conclusive that NZ’s taxing regime on returns is more favourable than Australia’s. In NZ for example, PIE tax can be applied at up to 28%, but only applies to some types of investment income, whereas in Australia, a flat tax of 10%/15% is generally applied, but only on interest/dividends/rent earned and when capital gains are realised.
Scenario D: Australian regime applied to all taxes and contribution rate
For the final scenario, we make one last change, by lifting the contribution rate from NZ’s 6% (3%+3%) to Australia’s 11.5% which comes into force this year. This adjustment has the single largest effect on Sam’s balance, almost doubling the previous scenario to about $1,415,000, made up of:
+$515,000 gross contributions (driven by higher contribution rate)
-$74,000 tax on contributions (same % rate as Scenario C)
+$1,068,000 pretax investment returns (a further $431,000 on top of Scenario C)
-$95,000 tax on investment returns (same % rate as Scenario C)

As shown by the increase in closing balance, applying Australia’s 11.5% employer contribution rate has a major impact on the final outcome. While it results in Sam’s career gross contributions being $213,000 more, these extra contributions, along with cumulative investment returns, bump up the closing balance by a further $573,000. Using the same calculation as prior scenarios, this $1,415,000 future balance provides almost 17 years of living expenses at $3,000 per month in today’s dollars.
In connection with the material impact of contribution rates, it is noteworthy that Australia’s ‘Superannuation Guarantee’ contribution rate was also 3% in the distant past, but has ratcheted up over the years, and is mandated to be 12% in mid-2025. This, coupled with the earlier inception of Australia’s system, has seen superannuation steadily grow to A$3.7 trillion at the end of 2023 (~A$140,000 per capita) versus KiwiSaver at NZ$0.11 trillion (just ~NZ$20,000 per capita). In reality, because of the long accumulation lifecycle, even if NZ were to adopt Australia’s contribution rate today, it would take several decades before retirees withdrawing would see the full benefit.

Bringing it all together, two key conclusions emerge. The first is apparent from the gap between Scenario A (current NZ system) and Scenario D (with the Australian regime applied) in the chart below.

If our hypothetical Sam was embarking on a career and considering retirement savings as one piece of the puzzle, the Australian system is far superior, and results in a nest egg 1.8x larger (or over $600,000 more) versus New Zealand. Beyond that there is also an earlier preservation (access) age, and the benefit of all superannuation earnings being tax free when Sam moves from ‘accumulation’ phase into ‘decumulation’ phase and starts drawing down.
The second conclusion is less obvious, and has to do with both taxes and the deadweight loss caused by taxes hindering the compounding effect of Sam’s contributions and investment returns. Together, these two costs mean Sam’s ending balance in each scenario is less than what the potential balance could have been if there were no taxes. This gap tells us that NZ’s system (Scenario A) is inefficient versus Australia’s regime (Scenario D).

Put simply, in Australia, Sam’s actual balance is 79% of potential, whereas in New Zealand, it is only 68% of what it could be in a tax-free world. When translated into dollars, this difference gets magnified by the compounding effect of contributions. As is the case with potential salaries for many job roles, this dollar difference contributes both to the desertion of aspirational Kiwis across the ditch, and a larger liability for a future means-tested NZ Super as lower balances mean less self-sufficiency and greater reliance on the public purse. Importantly, the potential balance in NZ necessarily reflects the 3% personal contribution being grossed-up for tax that has already been paid on it.
Coming back full-circle, it is difficult to argue that our retirement savings system is fit-for-purpose, especially compared with our neighbours’ across the ditch. Not only do we have an absence of strong incentive to save, but the design of the system dilutes the ability of wealth which sits within KiwiSaver to compound effectively for the future.
The system is unambiguously in need of reform, and whilst the recent retirement commission report puts forward some mild proposals, a bolder ‘shaken not stirred’ approach to recalibrate taxation and contribution settings is needed. As dependency ratios deteriorate due to an ageing populace, it is not a fait accompli that NZ Super will have the capacity to be a universal and adequate safety net generations from now, hence the need for stronger individual redundancy. A lower public funding burden also creates more future scope to reduce taxes, noting New Zealand’s more regressive brackets mean that the vast majority of earners pay a higher effective tax rate than they would in Australia.
Whilst there is inevitably a great deal of politicisation and conjecture around retirement savings, the proof is in the pudding, and perhaps we need less working group and more working model. The better outcomes underpinned by concessional tax and stronger contribution can already be seen across the ditch, but getting there requires the courage to accept some short-term pain for long-term gain, which is most always easier said than done.
***
Bonus Scenario: The Productivity Effect
Online KiwiSaver balance calculators from providers are required to use FMA assumptions which include a 2% inflation rate to bring the future ‘nest egg’ value back into today’s dollars, and 3.5% for annual wage growth.
In the scenarios discussed above, the 3% p.a. growth for Sam’s wages is higher than the 2% midpoint of the RBNZ’s target inflation band. This extra 1% reflects productivity, i.e. that the more efficient use of labour and capital over time (due to upskilling, technology, experience etc.) enables wages to grow faster than inflation.
The economy-wide level of productivity also has a significant impact on KiwiSaver balances via the channel of wage growth. Below is a bonus chart which shows a low productivity scenario, where wages only grow at inflation; along with a high productivity scenario where wages can grow at twice the rate of inflation.
The significant difference between the two illustrates the contrast between an economy which can generate growth by using its resources more efficiently and adding value to its outputs, versus an economy that can’t grow except by using more resources. New Zealand has recently fallen more into the latter camp, the decline in real GDP growth per capita reflecting productivity going backwards.

Disclaimer & Footnotes
The author is Head of Australasian Equities for the QuayStreet Funds and QuayStreet KiwiSaver Schemes. Smartshares Limited is the manager and issuer of those schemes and a product disclosure statement for each of them is available from https://quaystreet.com/documents
This article is for informational purposes only and is not, nor should it be construed as, investment advice for any person. The scenarios in this article are only intended to broadly map out some key disparities between retirement systems. To prevent the presentation being excessively complex, some simplifying assumptions have been made, which include continuous taxation of returns at respective ETRs, holding income/ESCT tax brackets and rates constant, and addressing the issue of NZ’s taxing point by grossing-up KiwiSaver contributions with tax to better show the actual tax leakage that occurs.
These assumptions mean the dollar values outcomes will differ from actual experience, but notwithstanding, shouldn’t impact the qualitative conclusions reached in comparing the two systems.
* On incomes higher than approximately $30,000 in NZ, the combined income tax and ACC earner’s levy results in effective tax rates higher than Australia’s 15% concessional contribution rate.
**Because of the enormous complexity around how different types of income within each country’s retirement systems are taxed, effective tax rates or ‘ETRs’ have been applied based on tax incurred historically:
For KiwiSaver, ETR is taxation over 10 years as a % of gross income from scheme assets over the same period, using latest available FMA data (to 2023).
For Australian Superannuation, ETR is calculated the same way using the latest ATO data (to 2021) which encompasses both large APRA-regulated entities and self-managed funds.
* Xavier Waterstone is Head of Australasian Equities at QuayStreet Asset Management.
Speak to a KiwiSaver expert about your KiwiSaver funds and future retirement projections! Reach out to us today for a quick chat, or complete one of our quizzes below and we will be in touch to discuss your Investment, Retirement or KiwiSaver options.
Compound Wealth are based in Mount Maunganui, Tauranga and offer KiwiSaver, Investment & Retirement Financial Advice to clients all over New Zealand.